A table is a range of cells that hold data, with each row corresponding to a single occurrence of an entity. When you create a table, you can manage and analyze the data in that table independently of data outside the table. You can format the table, filter the table columns and also publish a table to a server that is running Windows SharePoint Services 3.0 or Windows SharePoint Services “4?. Usually there is an initial row of text headings that describe the columns of data. For example, you might have rows and rows of employee data with the following column headings:
- First Name
- Last Name
- Age
- Salary
Each row in the table would hold the above details for a particular employee. But as Excel 2010 handles tabular data perfectly well by default, why would you want to put your data into a table? Well, tables allow Excel to respond more appropriately to your data if it is held in a a table. For example, if you create a chart based on the data in a table, the chart will expand as you add more rows to that table.
Creating Tables In Excel 2010
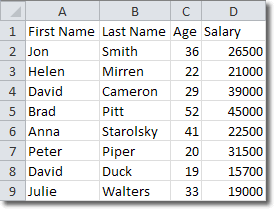
It’s quite easy to create a table in Excel 2010; you simply make a cell active that is in the range of cells you want to convert into a table and then click Insert > Tables > Table. If your data has headers, make sure to check the My table has headers box in the create table window, and then those headers will be used. The good thing is that you don’t need to select the entire range of cells: Excel can identify the limits of the data and also identify the headings. The following is an example of tabular data before we convert it into a table.

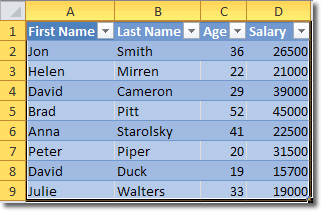
After we convert it to a table, it looks like this:

If you create a table this way, it is given default formatting that you can change using the Table Styles on the Design tab that appears when the table is selected. Alternatively, you can select a style when you create the table. To do this, activate any cell in the range you want to convert and click Home > Styles > Format as Table. Choose a style from the panel that opens and your table will be created with that style.
Properties Of Excel Tables
The main things to notice about tables are:
- When any cell in the table becomes active, the Table Tools contextual tab is displayed.
- Each column heading contains a drop down list that you can use to sort or filter the data in that column.
- If you scroll so far down the table that the column headings disappear, the letters that mark the column headings in the worksheet are replaced with the table’s column headings.
- The cells have background colours to enhance readability.
- Background colours are applied to the cells to help readability.
Deleting An Excel Table
If you later decide that you’d prefer your data in its original form (i.e. not in a table), you can convert it back to a range of cells. Click anywhere in the table and then on the Table Tools tab, click Design > Tools > Convert To Range. Once the data is converted back to a range, the table features are no longer available.
Note that the formatting that was applied to the table is still present.
If you want to delete the table and all its data, select the table and press the delete key.

