Planet For Application Life Development Presents
MY IT World

Explore and uptodate your technology skills...

Content
Powerpoint - Add A Sound File To An Object
Powerpoint - Add Sound
Powerpoint - Animation Painter
Powerpoint - Animations
Powerpoint - Artistic Effects
PowerPoint - Backgrounds
Powerpoint - Backstage View
Powerpoint - Bokeh Backgrounds
Powerpoint - Charts
Powerpoint - Compress A Presentation
Powerpoint - Convert Video
Powerpoint - Convert Video Using Camtasia
PowerPoint - Converting Text To SmartArt
Powerpoint - Create A Quiz
PowerPoint - Create A Speech Bubble
PowerPoint - Create A Template
PowerPoint - Create A Theme
PowerPoint - Create Animated Backgrounds
PowerPoint - Creating Shapes
PowerPoint - Curved Text
Powerpoint - Developer Tab
PowerPoint - Embed Your Website
PowerPoint - Embed Videos From Your Hard Drive
PowerPoint - Embed Youtube Videos
PowerPoint - Extract The Background Image
PowerPoint - Formatting Video
Powerpoint - Handouts
PowerPoint - Hyperlink
PowerPoint - Insert A Table
PowerPoint - Insert An Excel Spreadsheet
PowerPoint - Insert Images
PowerPoint - Key Tips
PowerPoint - Make Sound Start Automatically
PowerPoint - Notes
PowerPoint - Open PPT Or PPTX Files
PowerPoint - Paste
PowerPoint - Calendars
PowerPoint - Transparent Text
PowerPoint - Viewer
PowerPoint - Presentation Views
PowerPoint - Remove The Background From An Image
PowerPoint - Rotating Text
PowerPoint - Save As PDF
PowerPoint - Selections
PowerPoint - Shapes
PowerPoint - Slide Layouts
PowerPoint - Slide Transitions
PowerPoint - Speech Bubbles
PowerPoint - Template
PowerPoint - The Ribbon
PowerPoint - Themes
PowerPoint - Clip Art
PowerPoint - Venn Diagram Template
PowerPoint - Video
PowerPoint - What Makes A Good PowerPoint Presentation
PowerPoint - WordArt

Powerpoint - Charts

Inserting charts into your PowerPoint presentation is an excellent way of giving your audience numerical data or statistical information at a glance. This numerical data must come from somewhere, so whenever you insert a chart, PowerPoint automatically opens Excel. You can then use Excel to feed your PowerPoint chart with the data you insert into your Excel spreadsheet.

Let’s insert a chart now. Click Insert > Chart, and select a chart from the Line category.
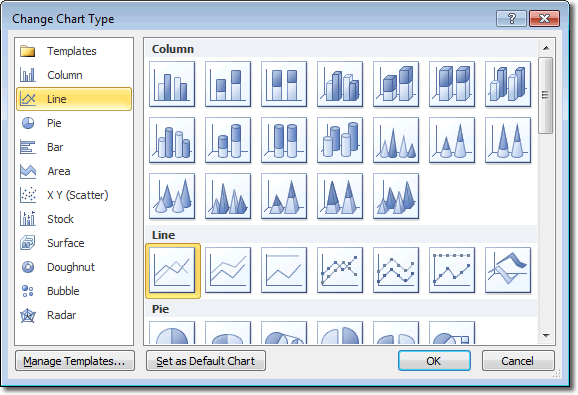
Insert A Line Chart In PowerPoint

When Excel opens, you will see a default selection of headings and data rows that you can amend. The PowerPoint and Excel programs resize so that you can see both side by side, and any changes you make to the Excel data updates the chart in PowerPoint immediately. When you have finished entering your numerical data, all you have to do is close down Excel and PowerPoint keeps the data in the chart. As there is now more space available, PowerPoint expands to fill that space.
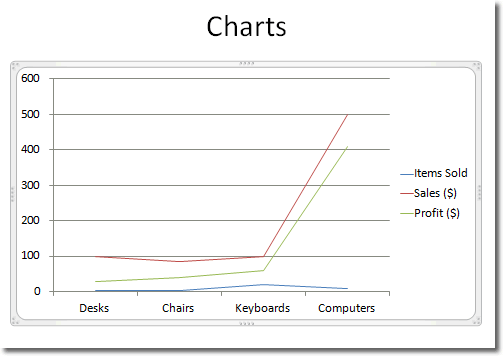
Charts In PowerPoint

If you need to change the data presented by the chart, select the chart and then in the Chart Tools tab, click Design > Data > Edit Data. As before, Excel opens again and both PowerPoint and Excel are displayed side by side. You can then add, change or delete data in your Excel spreadsheet. Close down Excel when you are finished and your changes will be saved in the PowerPoint chart.

Changing The Chart Type

The chart we inserted was a line graph. If, after entering our data, it turns out that a different type of chart is more appropriate, we can always change the chart type. Select the chart and in the Chart Tools contextual tab click Design > Type > Change Chart Type. Select a chart type from the different categories on display.